


wTVision provides ESPN Latin America with live data and graphics solution
wTVision and Mediapro Argentina carried out for ESPN a project aimed at the automation of the on-air graphics and the seamless integration of live data into the SportsCenter+ program.
ESPN needed an intuitive solution, capable of guaranteeing an automated data insertion in attractive graphics that could attract viewers and sponsors.
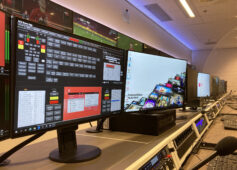
For this, wTVision designed a configuration with Studio CG (on-air graphics and video controller) as the engine of the show’s production, where live updates and events from competitions around the world are the main focus.
Studio CG receives all data from the Stats Perform data centre and, in combination with Viz Engine from Vizrt, is able to generate continuous broadcast graphics with relevant sports events.
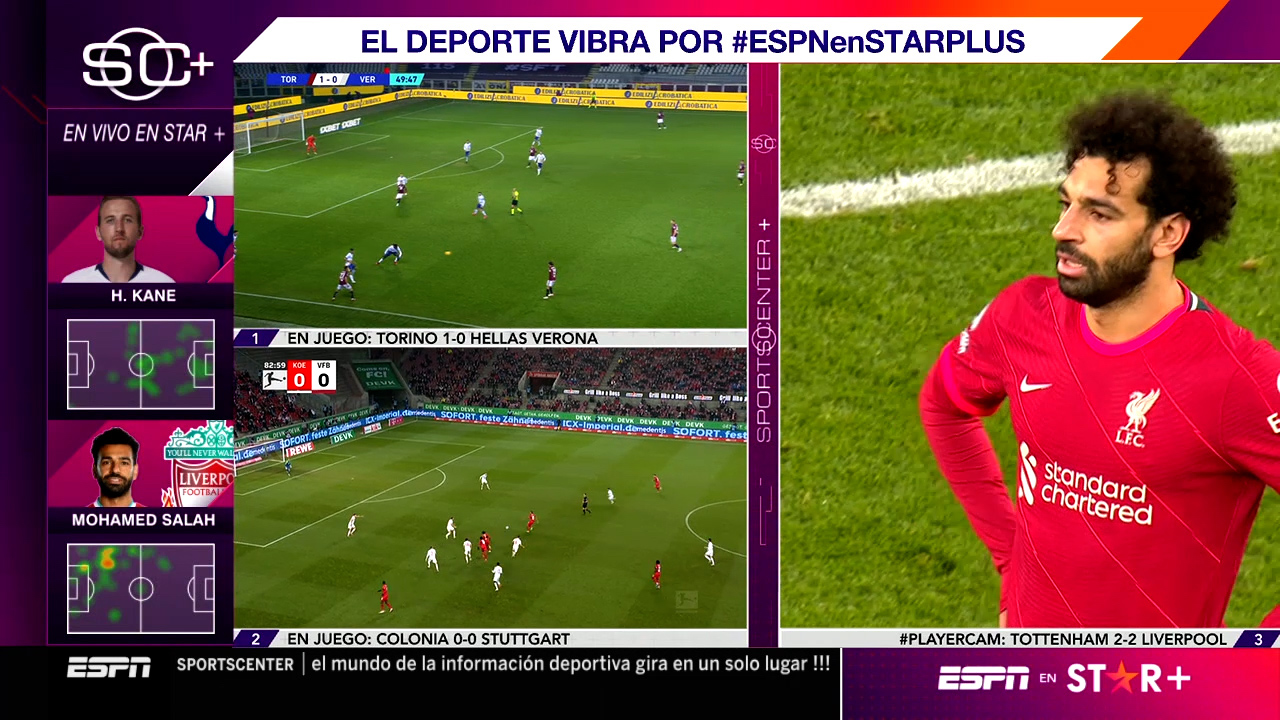
The data includes more than 15 football leagues from all over the world, with detailed statistics such as shots, corner kicks, ball possession, player performance… The same solution is now ready to integrate data from other relevant sports, such as Formula 1 or tennis.
Jorge Kossowski, account director at wTVision, highlights that “Studio CG is the perfect product to design solutions just like the one ESPN needed. Its flexibility and robust capabilities make it easy to integrate third-party data, adapt to our clients’ pre-existing workflows and completely automate the operation process.”
Automation
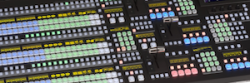
To make sure that nothing goes unnoticed when it comes to automation, the SportsCenter+ production team is equipped with a Studio Core and the Content Management Site, web-based tools where playlists can be customised, graphics and data prioritised and fully automated. With this simple solution, wTVision reduced the manual operation of the show and the time spent reorganising data and graphics during live broadcasts.
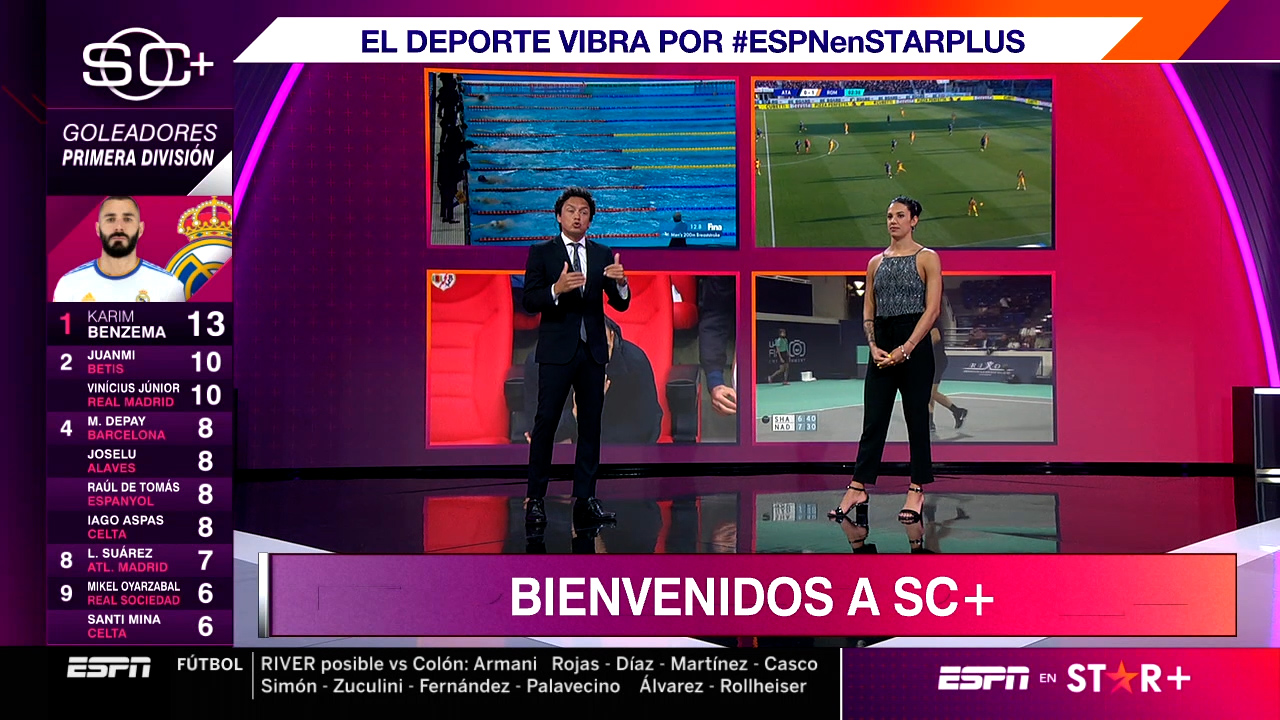
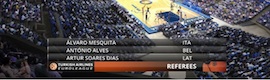
In addition, to better develop and integrate those relevant statistics during SportsCenter+’s long hour-long broadcast, the wTVision broadcast design team developed the creative package for all the graphics containing data. The creative team designed and integrated the on-air graphics where the information is displayed, keeping in mind the data component of the programme and the identity of the clients.
Kossowski acknowledges that “the creatives in charge of the project really respected the identity of the show and developed that L-bar graphic in a super intuitive way, for very limited space on the screen. Without that great look and feel, the data integration would be much less impactful. Our sports expertise allowed us to have complete freedom and create a design completely in sync with the sports the show is covering.”
https://youtu.be/kSI1tD_KN3k
¿Te gustó este artículo?
Suscríbete a nuestro NEWSLETTER y no te perderás nada.
Artículos relacionados
 Ross Video delves into Raiden, its graphics solution for meteorology
 Avid brings SaaS approach to Maestro graphics solution
 Reality Check designs graphics for new ESPN Netherlands with Ross Video solutions
 Vizrt turns Live Production into a cloud-first solution
 Mediapro y DirecTv Latin America ruedan en Madrid ‘El fútbol no es así’
 Brainstorm introduces at IBC 2017 Neuron, a new broadcast graphics management solution
 DirecTv Latin America y Mediapro desarrollarán la serie ‘El fútbol no es así’
 For-A named exclusive distributor of ClassX live 3D graphics line in North, Central and South America
 Canal F1 Latin America, único canal que ofrecerá todo el Mundial de Fórmula 1 en HD para América Latina
 wTVision proporcionó cobertura gráfica a ESPN Brasil en el primer partido de la NBA en América del Sur
La nueva móvil HD de Media Networks Latin America, a pleno rendimiento
wTVision proporcionó cobertura gráfica a ESPN Brasil en el primer partido de la NBA en América del Sur
La nueva móvil HD de Media Networks Latin America, a pleno rendimiento
 DirecTv Latin America selecciona a Aspera
 DirecTV Latin America se expande con ForeTV