


Audiovisual services are growing at a rate of 14% year-on-year
The CNMC publishes the telecommunications and audiovisual statistical data corresponding to the second quarter of 2015.
The National Markets and Competition Commission (CNMC) has released the telecommunications and audiovisual statistical data corresponding to the second quarter of 2015.
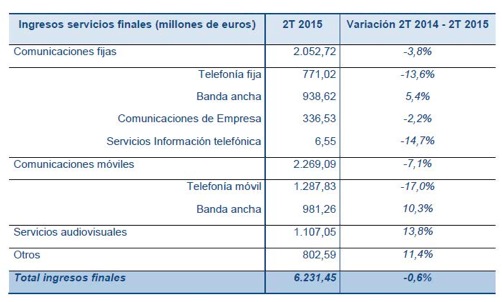
The total turnover of the sector in the second quarter of 2015 was 7,548 million euros, practically the same as that of the same quarter of the previous year. Added to the 5.8% increase in wholesale services was a slight drop in retail services, of 0.6%.
Audiovisual services and broadband services (both fixed and mobile) are the consumer services that increased their billing in the second quarter of 2015. Specifically, audiovisual services, with an increase of almost 14% year-on-year, have accumulated five consecutive quarters with positive variation rates, while fixed broadband experiences a year-on-year increase of 5.4% and mobile broadband, of 10.3%.
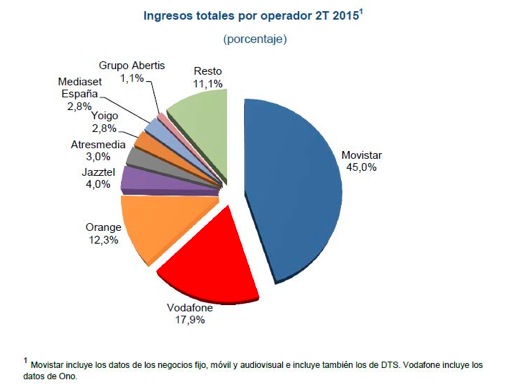
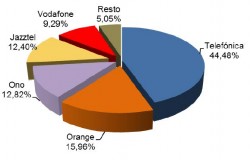
Regarding the data by operator, the income of the main operators remained the same compared to the second quarter of 2014, only Jazztel rose 2.6%. Movistar began to represent 45% of the sector's total after the purchase of DTS, and its income remained stable when compared to the income of both operators in the same sector the previous year. For Vodafone the income figure remained stable, compared to the sum of its income plus that of ONO in the second quarter of 2014.
In the field of free-to-air television, Atresmedia registered an increase of 13.4%, while Mediaset registered 3.3% less.
En el segundo trimestre del año, los accesos instalados NGA (acceso a redes de nueva generación, que permiten disfrutar de conexiones de muy alta velocidad) registraron una tasa de crecimiento anual del 41%.
En junio de 2015, el despliegue de estos accesos alcanzó la cifra de 29,5 millones, de los cuales 18,6 millones correspondieron a fibra hasta el hogar (FTTH)2, en contraposición a los 10,3 millones desplegados un año antes, lo que supuso un crecimiento del 80,8%.
Por otra parte, los accesos con tecnología DOCSIS 3.0 se situaron en torno a los 10 millones, con un ritmo de crecimiento discreto entre el 2% y el 3% interanual.
Los accesos NGA sobre los que se presta algún servicio supusieron 5,3 millones, un 37,5% más que hace un año. Sobre estos accesos se puede prestar cualquier servicio de telefonía fija, de banda ancha o de audiovisual.
En junio de 2015, las conexiones de banda ancha fija con una velocidad contratada de 30Mbps o superior ascendieron a 3,8 millones, un 58,8% más que el mismo mes de 2014. Así, las líneas de banda ancha fija comprendidas en este rango de velocidades representaron el 29,1% del parque total de líneas de banda ancha fija.
En junio de 2015, el total de paquetes cuádruples y quíntuples alcanzó los 8,8 millones, 1,7 millones de paquetes más que el año anterior. El paquete quíntuple, al igual que en 2014, fue el que experimentó el mayor crecimiento sumando 1,3 millones de altas netas hasta registrar 2,7 millones, frente a los 400.000 que sumó el cuádruple.
Por su parte, los paquetes dobles de telefonía más banda ancha fija y los triples, que incorporan además la televisión de pago, siguieron disminuyendo por la migración de estos paquetes a las modalidades cuádruple y quíntuple.
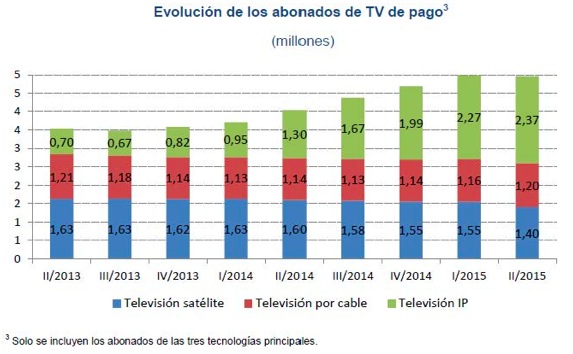
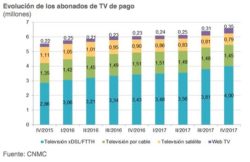
El parque de abonados de TV de pago viene creciendo desde el último trimestre de 2013, aunque en junio de 2015 se ha mantenido. Los abonados a televisión IP y cable crecieron frente a la bajada registrada por los de satélite.
Por otro lado, en el parque de líneas de banda ancha, ya sea a través de redes fijas o móviles, continuó creciendo al igual que en trimestres anteriores. El volumen total de líneas móviles que se conectaron a Internet creció un 11,3% en tasa interanual hasta los 37,3 millones. El motivo fue el importante aumento de las líneas de voz vinculadas a banda ancha móvil, que han sumado casi 4 millones de líneas desde junio de 2014, hasta alcanzar los 35,7 millones, mientras que el parque de datacards se situó en 1,7 millones. Por su parte, se registraron 13 millones de líneas de banda ancha fija, lo que supuso un incremento del 4,7% en el último año.
En la evolución de las líneas de banda ancha fija por tecnología se aprecia el descenso de las conexiones xDSL a partir del segundo trimestre de 2014, coincidiendo con la presencia cada vez más significativa de líneas FTTH. Desde junio de 2014, se han sumado 1,3 millones de líneas de fibra frente a una pérdida de 928 mil con tecnología xDSL.
Did you like this article?
Subscribe to our NEWSLETTER and you won't miss anything.
Related articles
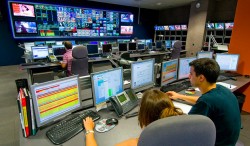
 The largest teleport of Telefónica Servicios Audiovisuales, inside
 Income from audiovisual services fell by 11.9% in 2020
 Telefónica Servicios Audiovisuales (TSA) completely renews its website
 Audiovisual services and mobile broadband, drivers of growth in the telecommunications sector in 2018
 Revenue from audiovisual services stands at 1,170 million euros, with a year-on-year increase of 4.1%
 NEP Group acquires Australian audiovisual services company Big Picture
 The billing of audiovisual services and broadband pulled the telecommunications sector in 2017
 Telefónica Servicios Audiovisuales and VSN sign a strategic agreement
 FTTH are growing in Spain at a rate of more than 100,000 lines per month
 Tres60 provides audiovisual services to the production company ZZJ
 Mediabackoffice: servicios audiovisuales online de Maragda Mediàtica
 Telefónica Audiovisual Services integrates Dalet Radio Suite HD into RNE
 ASIMELEC evaluates the decrease in the audiovisual services sector at 11%
 Trigital equips the new 2K room at Nasa Audiovisual Services