


Los cien principales actores del sector audiovisual europeo crecen el doble que el mercado

He European Audiovisual Observatory publica una nueva edición de su informe anual sobre los principales actores del sector audiovisual en Europa y arroja luz sobre la estructura de la industria audiovisual en términos de ingresos
El informe, Top players in the European audiovisual industry – ownership and concentration, ha sido elaborado por Laura Ene, analista del Departamento de Información de Mercados del Observatorio.
El análisis ofrece instantáneas de los principales actores del sector audiovisual y explora la concentración, el estatuto y el origen de la propiedad en función de los ingresos, las suscripciones a la televisión de pago, las suscripciones a SVOD, el número de canales de televisión, el número de servicios a la carta, las audiencias de televisión, el número de títulos de ficción televisiva producidos y el número de pantallas de cine. También proporciona vistas transversales para los actores activos en más de un segmento de mercado.
Esta 2ª edición del informe introduce varios ángulos de análisis nuevos, como la evolución de las clasificaciones con respecto a las presentadas en la edición anterior y una nueva contextualización en el contexto de las fusiones y adquisiciones, estudios de casos que ilustran las pautas de presencia europea y los modelos de expansión de los grupos seleccionados, así como un análisis de los principales propietarios de canales de pago y servicios SVOD.
Las 100 principales empresas audiovisuales de Europa por ingresos de servicios audiovisuales operativos fueron muy resistentes, dinámicas e impulsaron el crecimiento general del mercado audiovisual.
La actividad de fusiones y adquisiciones aumentó recientemente impulsada por las empresas de telecomunicaciones y esta actividad se concentró más en la región de Europa Central y Oriental (ECE).
Los principales actores del sector audiovisual en Europa son eclécticos en cuanto a su actividad principal, que es la que genera los ingresos, y a su estrategia de internacionalización.
Por otro lado, en el mercado de los servicios de pago, excluida la distribución de servicios de terceros por las telecos, los radiodifusores obtuvieron la parte del león de las suscripciones dentro de todo el mercado europeo de servicios de pago.
Ingresos
Los ingresos de explotación de servicios audiovisuales acumulados de las 100 principales empresas audiovisuales de Europa crecieron entre 2016 y 2021 el doble que el mercado global y a un ritmo superior al de la inflación media. En otras palabras, las 100 principales empresas crecerán un 17% en 2021 en comparación con 2016.
La evolución positiva del mercado global de servicios audiovisuales se debió al gran dinamismo de los ingresos de SVOD. Mientras tanto, los ingresos acumulados de los actores principalmente tradicionales (es decir, la radiodifusión y la distribución de televisión de pago) entre los 100 principales también aumentaron en 2021 (+10% con respecto a 2016) en contraste con la evolución general de los segmentos tradicionales del mercado.
Los operadores tradicionales aportaron el 56% de los ingresos adicionales obtenidos por los 100 primeros grupos durante el mismo periodo. Sin embargo, el crecimiento de los 100 principales grupos fue impulsado en gran medida por los operadores SVOD puros, a saber, Netflix, Amazon, DAZN y Apple. Sus ingresos acumulados se multiplicaron por 6 entre 2016 y 2021 y representaron el 44 % del crecimiento de los 100 principales actores.
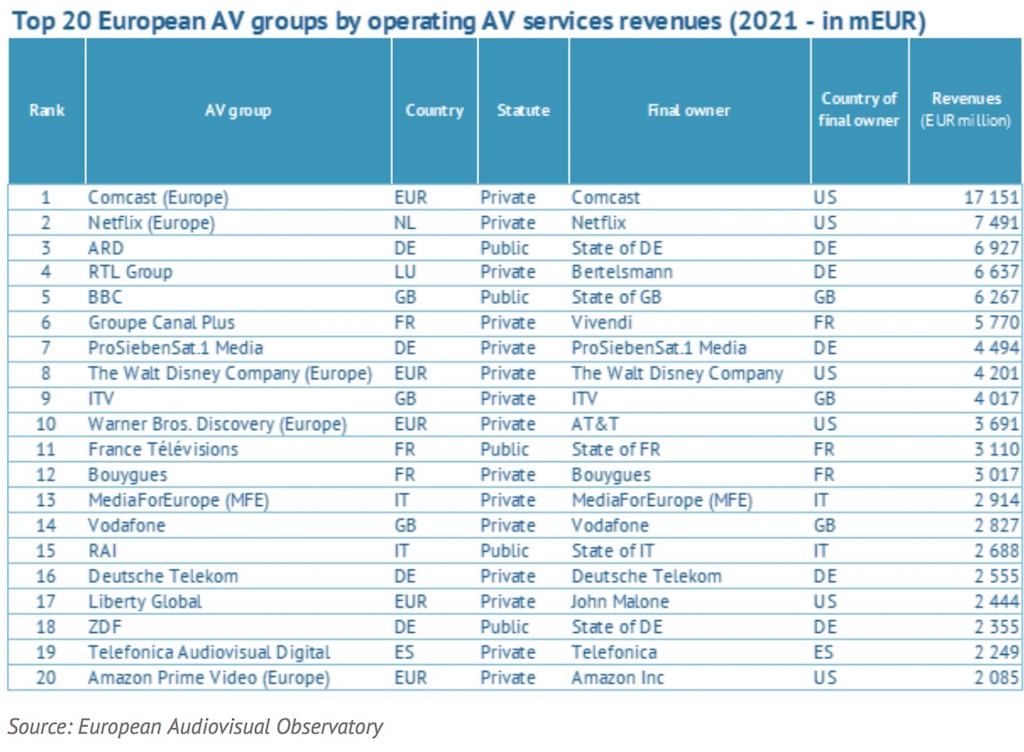
Los 20 principales actores representaron sistemáticamente el 71 % de las 100 principales cifras de ingresos durante el mismo periodo analizado. Los actores públicos (RSP) mostraron un desarrollo por debajo de la tasa media de crecimiento de las 100 principales empresas audiovisuales y en 2021 vieron disminuir su peso en un 3% en comparación con 2016 y, en consecuencia, su cuota de mercado cayó al 30% en 2021.
He peso de los intereses estadounidenses en los ingresos de las 100 principales empresas aumentó en 2021 (un +3 % con respecto a 2016, hasta una cuota de mercado del 30 % a finales de 2021) debido principalmente al aumento de los operadores SVOD puros, pero también de los servicios SVOD de los organismos de radiodifusión respaldados por Estados Unidos, como Sky, Paramount+ y Disney+. Los operadores estadounidenses tienden a dar prioridad a la expansión a través de inversiones directas mediante el lanzamiento de plataformas de vídeo a la carta, la adquisición de activos europeos y la producción local de contenidos, frente a las inversiones indirectas tradicionales.

Mercado SVOD
El SVOD destaca como el segmento del mercado audiovisual más concentrado en Europa, seguido de la televisión de pago. A finales de 2021, un total del 71% de las suscripciones a SVOD fueron acumuladas por abonados a las 3 principales plataformas OTT (es decir, Netflix, Amazon y Disney+), mientras que el 76% de las suscripciones a la televisión de pago fueron acumuladas por los 20 principales operadores de televisión de pago.
Las suscripciones a servicios audiovisuales de pago (televisión de pago y vídeo a la carta) acumuladas en 2021 por los principales operadores de servicios audiovisuales de pago que poseen al menos un canal de televisión de pago destacado o una plataforma de vídeo a la carta muestran un hecho interesante. En efecto, se puede deducir que los intereses de los grupos de propiedad europea responden a un perfil muy diferente del de los grupos de propiedad estadounidense en Europa.
Los radiodifusores de destacados canales de televisión de pago representaban más del 80% de la cuota europea de suscripciones acumuladas a servicios audiovisuales de pago. A diferencia de los operadores de vídeo a la carta puros en general, los radiodifusores respaldados en Europa tienden a ser también activos en el segmento de la televisión de pago, del que obtienen una media de la mitad de sus suscripciones acumuladas a servicios de pago audiovisual.
Por el contrario, las plataformas SVOD puras están impulsando el 70% de la cuota estadounidense de suscripciones a servicios de pago por visión, mientras que el resto de las suscripciones las acumulan las grandes cadenas estadounidenses y las cadenas europeas respaldadas por Estados Unidos.
Did you like this article?
Subscribe to our NEWSLETTER and you won't miss anything.
Related articles
 AEQ is committed to the European market with the incorporation of Sandra Serrano
 Germany, new leader of the European SVOD market, surpassing the United Kingdom for the first time
 The Television Academy addresses the challenges of the audiovisual sector in the European Parliament
 Incorporating qualified professionals, one of the main challenges of the sector
 Five main predictions for the audiovisual sector in 2019
 One hundred percent Christie technology in the new Odeon Sambil multiplex in Madrid, the most advanced in Europe
 Digital convergence, the flight of listeners and the absence of regulation, main challenges for the radio sector
 Avid Everywhere se abre aún más a los principales actores del sector
 Sony promueve una interfaz de medios en red con la colaboración de las principales organizaciones de broadcast del sector
 International sales of Spanish audiovisuals grow by 18%
 The European audiovisual market represents 107.4 billion euros of the Union's economy
 Las expectativas del sector del digital signage crecen en España
 El proyector DLA-F110 debuta en el mercado europeo en ISE 2011
 Christie DHD800, uno de los proyectores de doble lámpara mas brillantes del mercado